How do you reach the full potential of your SFNs?
In large SFNs, where the transmitter separation distances exceed the selected guard interval length, self–interference zones might occur within the required service area. These zones might have a very strong negative impact on the network coverage probability. The network planner can apply several different approaches to mitigate the negative effect of the self–interference zones. The self–interference zones can for example be “moved” to areas outside the required service area by assigning thoughtful delays on the transmitters that builds up the SFN. Doing this manually is a tedious and time consuming process.
To help the network planner in this process PROGIRA® plan has been equipped with the SFN Optimization tool. This tool uses advanced optimization algorithms that automatically assign delays to the transmitter so that the self-interference zones are moved to areas with least impact on the population coverage.
Other parameters that can be optimized to mitigate the effects of the self-interference zones are: transmitter locations, transmitter powers, antenna heights, antenna patterns, antenna down tilting, polarization, etc.
An example where PROGIRA® plan SFN Optimization tool is used
In the following example a DVB–T2 network must be designed to provide indoor coverage with a bitrate capacity of at least 34 Mbit/s within the required service area. The required service area is 5 140 square kilometers and the population within this area is 143 950. To meet the capacity requirement the DVB–T2 system parameters presented in Figure 1 have been selected.

Figure 1: Selected DVB-T2 system parameters to meet the capacity requirement of at least 34 Mbit/s.
At our disposal we have eight (8) transmitters where the separation distances far exceed the selected guard interval. These transmitters can be divided into three different types of classes:
- Large: ERP 47 dBW, antenna height 300 meters;
- Medium: ERP 37 dBW, antenna height 75 meters;
- Small: ERP 34 dBW, antenna height 50 meters.
The SFN consists of one (1) Large, three (3) Medium, and four (4) Small transmitters. In the following coverage maps these transmitter classes can be identified by the size of the transmitter icons, the larger the icon the greater transmitter. All transmitters also use omni-directional antennas.
In Figure 2 and 3 the self-interference zones and the indoor coverage map is presented for the case when no delays have been assigned to the transmitters. The self-interference zones are significant, only 48% of the service area and 52% of the population meet the coverage requirement.
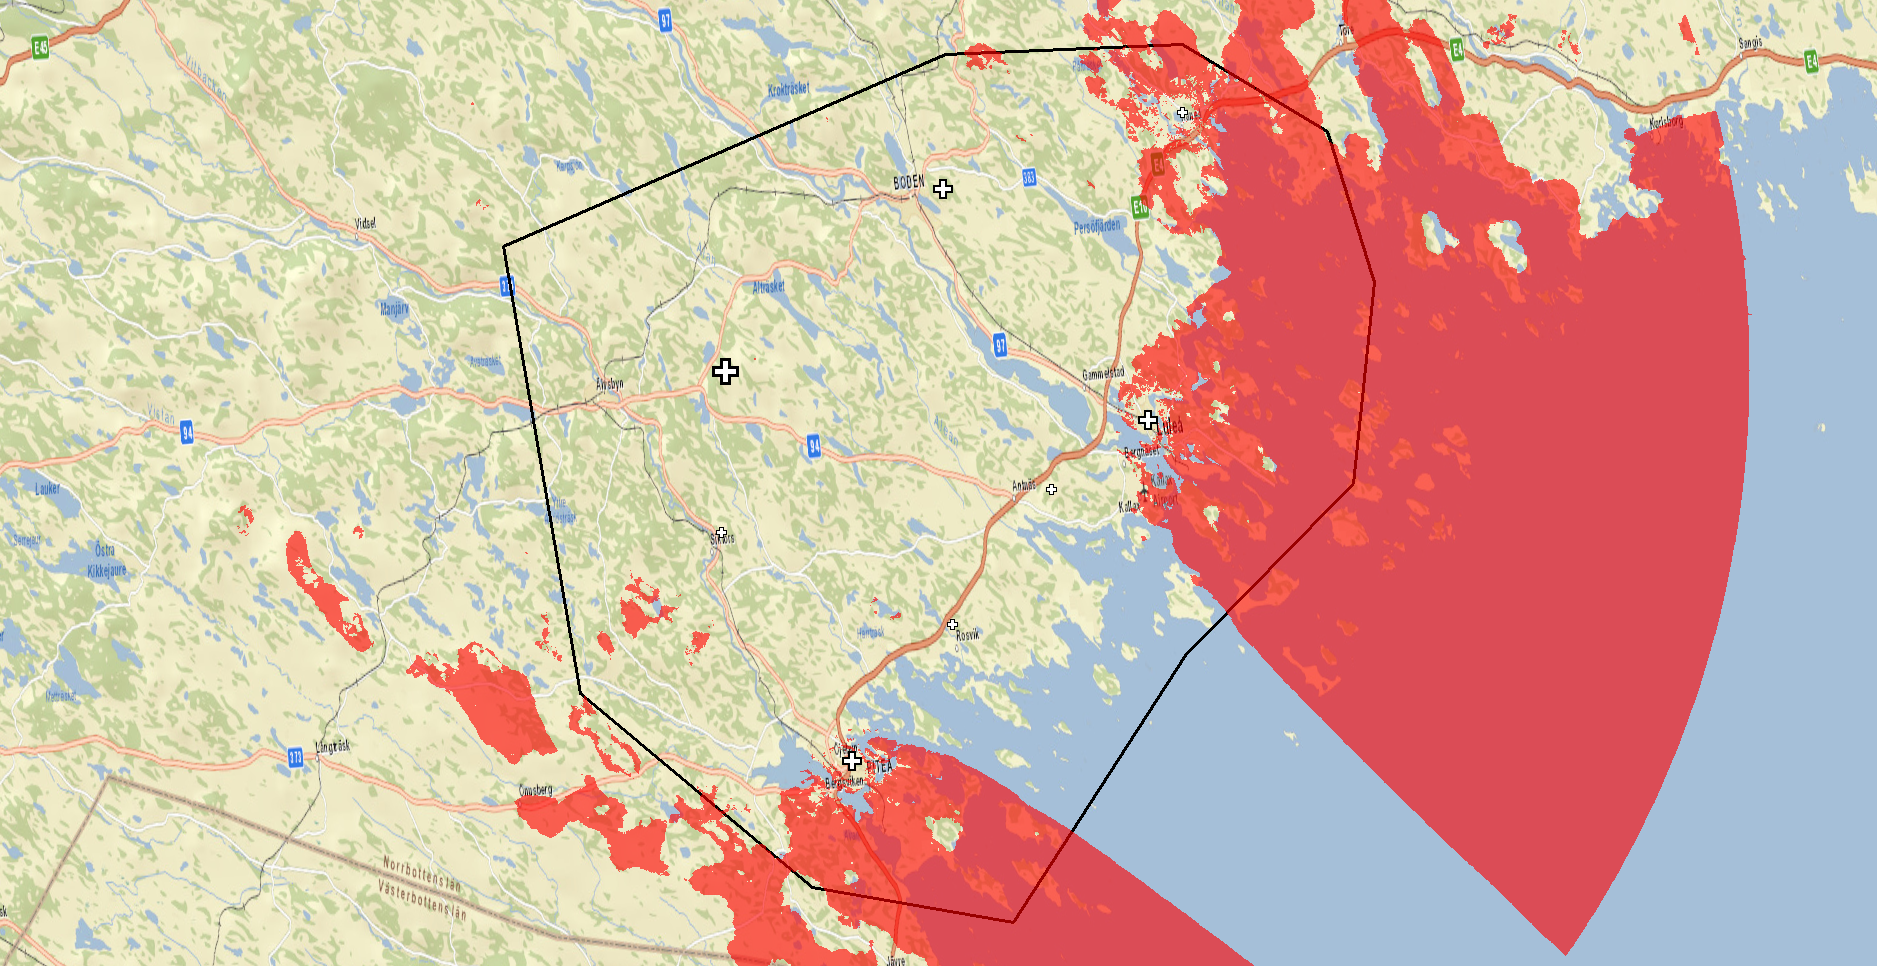
Figure 2: Self-interference zones when no delays are assigned to the transmitters.
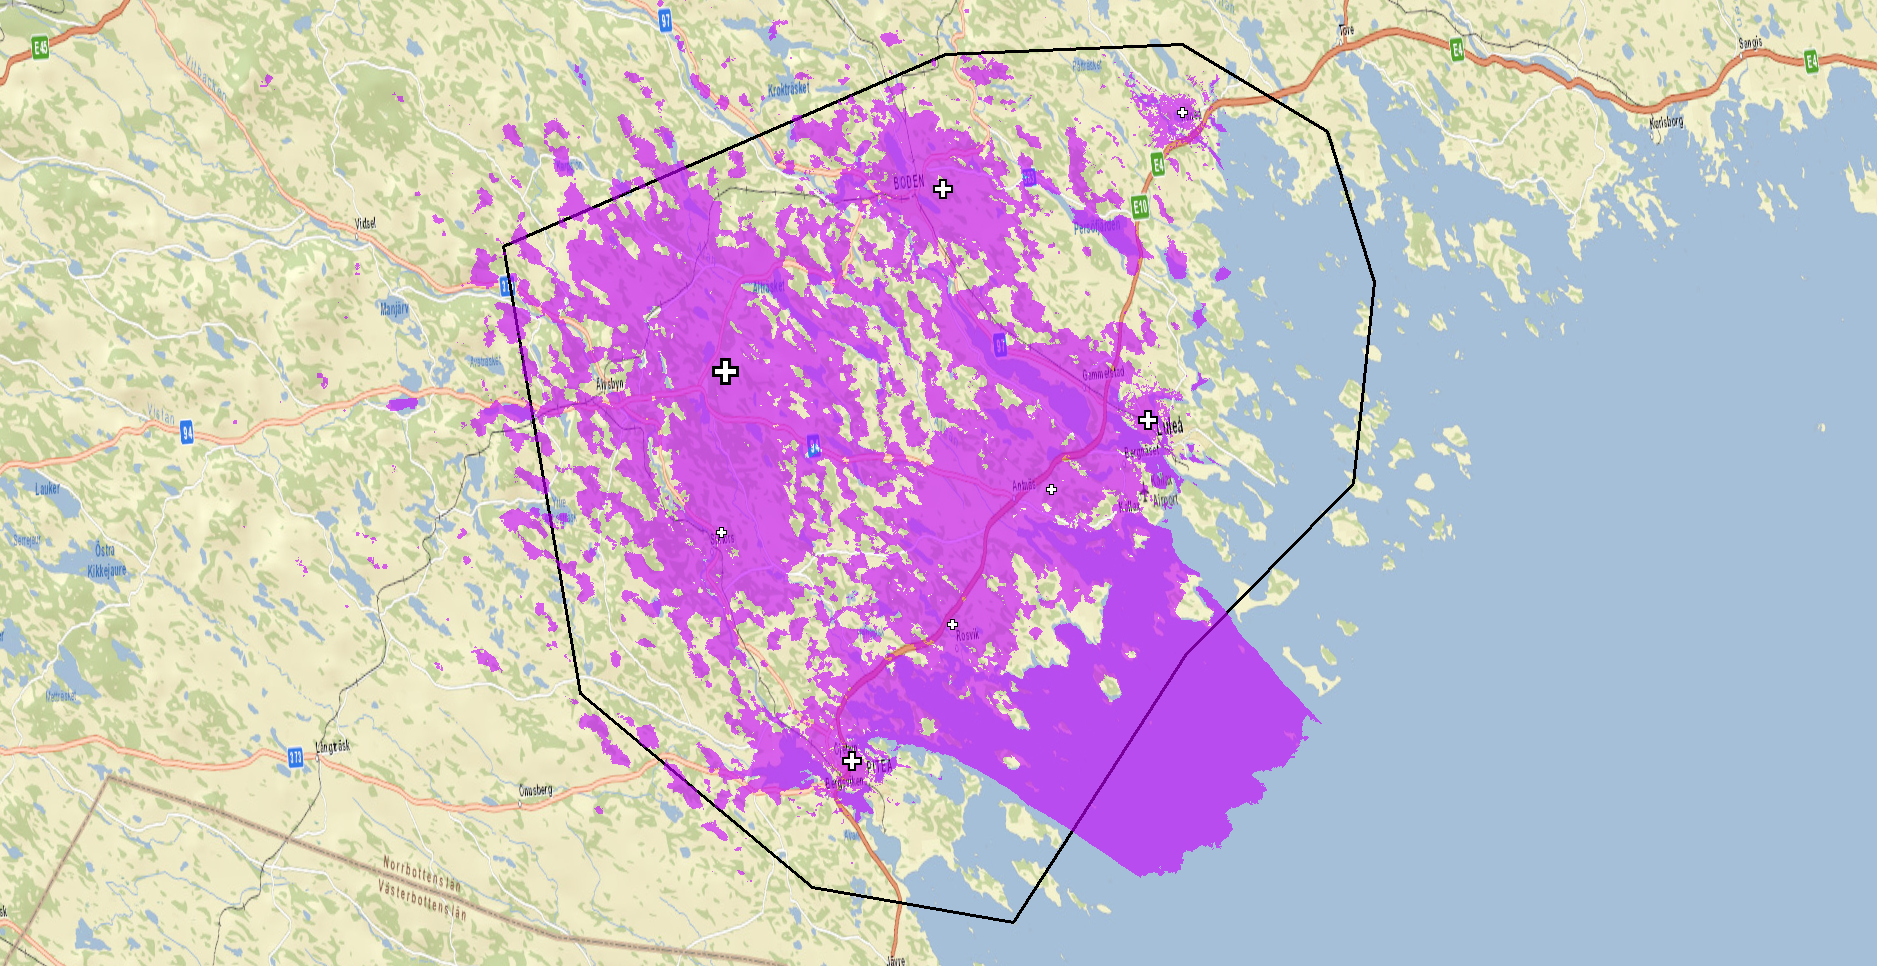
Figure 3: Indoor coverage map when no delays are assigned to the transmitters.
By using the SFN Optimization tool, and by only optimizing the individual transmitter delays, these self-interference zones have been removed, see Figure 4 and 5. We can conclude that the self-interference zones have been reduced significantly, 62% of the service area and 85% of the population now meet the coverage requirement. A significant improvement!
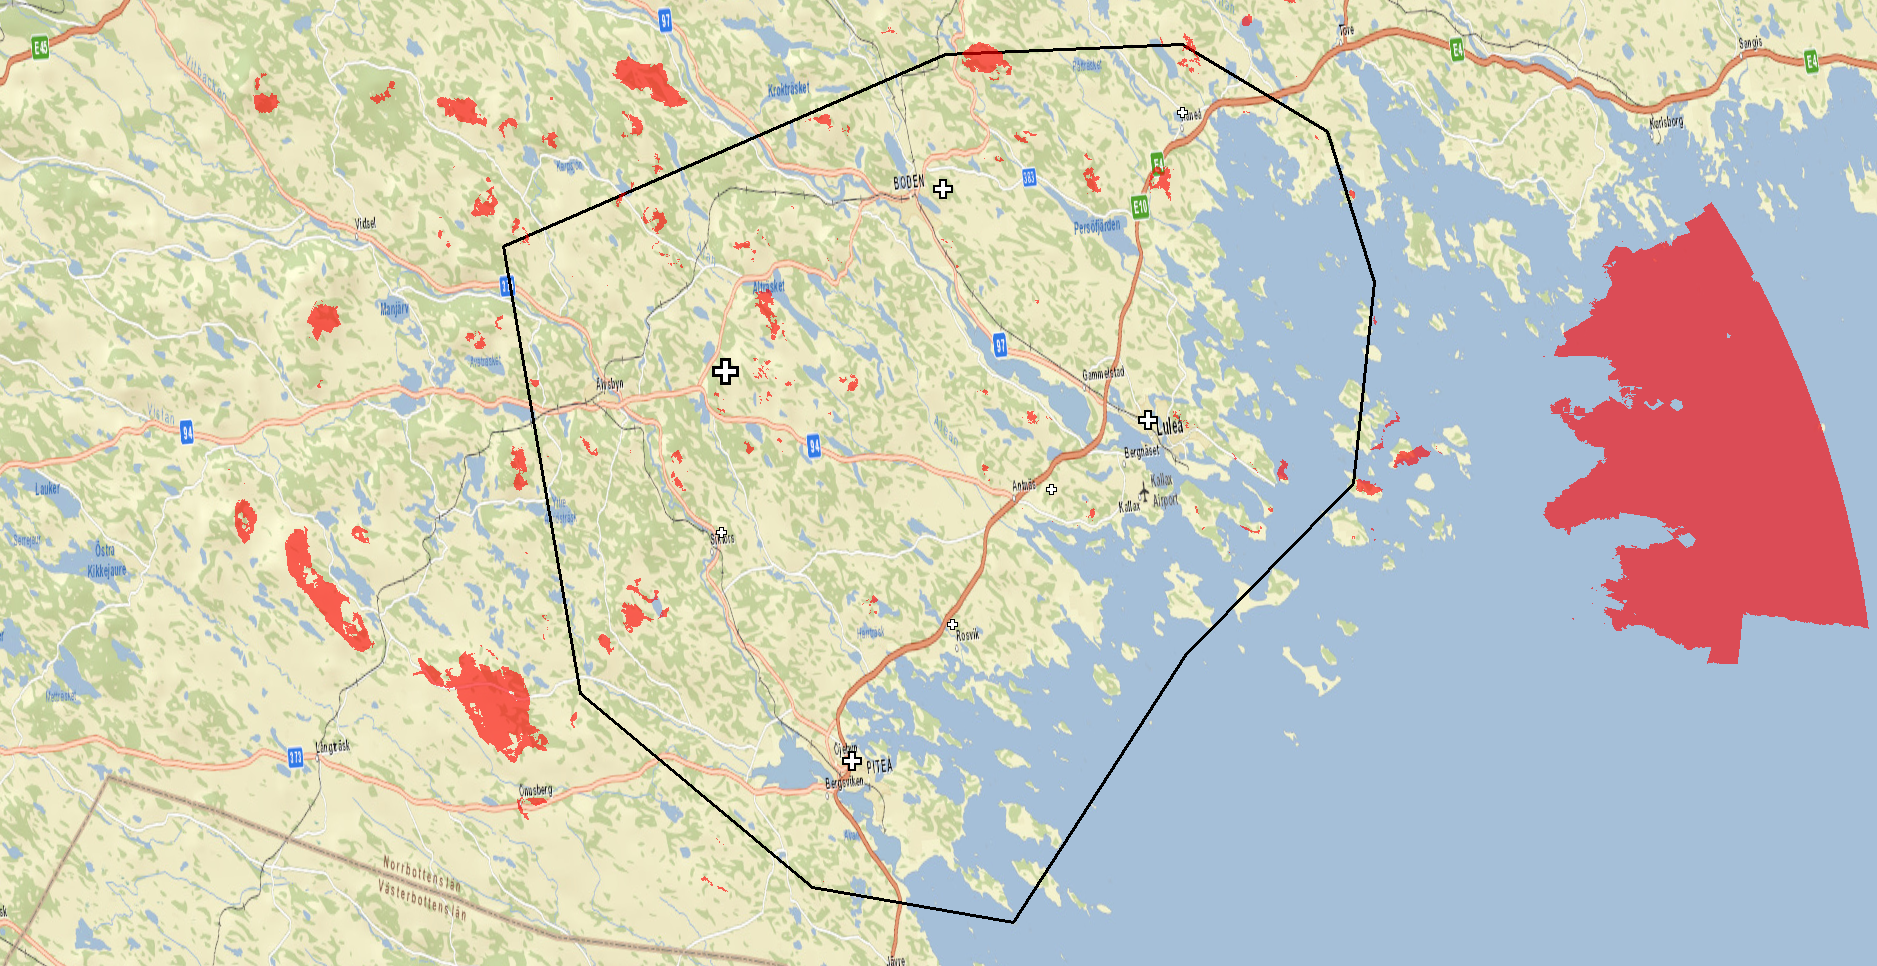
Figure 4: Self-interference zones when optimized delays have been assigned to the transmitters.
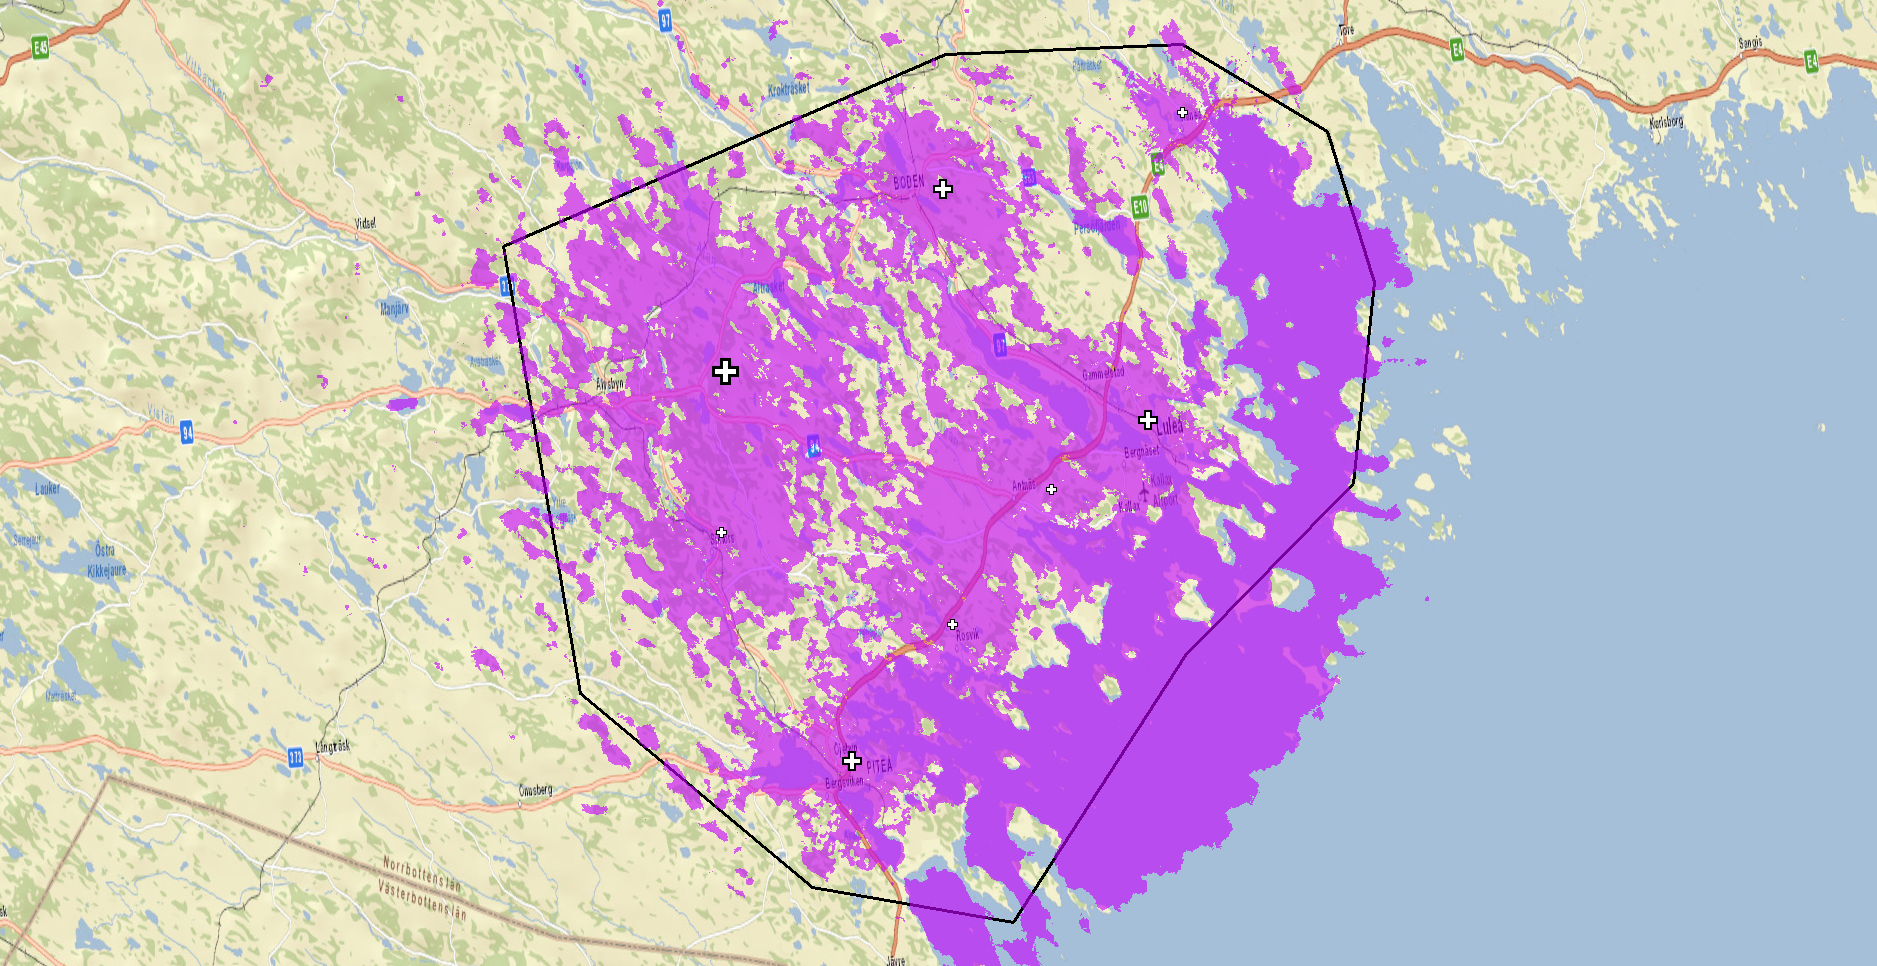
Figure 5: Coverage map when optimized delays have been assigned to the transmitters.
–
Thank you for reading this post regarding SFN Optimization and how to reach the full potential of your SFNs by using the tools in PROGIRA® plan. Please share and comment. All feedback is welcome!
