The Importance of a Site Survey
In radio network planning projects it is more of a rule than an exception that the given site coordinates are inaccurate compared to the resolution of the underlying terrain database. If inaccurate input data is entered into the radio network planning software, the resulting output will also be inaccurate. Garbage in, garbage out!
The purpose of this blog post is therefore twofold: firstly, to describe why and under what conditions such inaccurate site locations might have a very profound effect on the important field strength calculations, and secondly, to clearly convince why a thorough site survey always should be conducted before starting the field strength calculations.
In radio network planning software the signal strength contribution from a specific transmitter is estimated by a radio propagation model on a regular grid of points. Usually, this grid will have the same resolution as the terrain elevation database used by the radio propagation model. As a consequence, each grid point can be seen as an area of corresponding size, for example 50 meter × 50 meter. These small areas are called pixels.
In strongly hilly and rolling terrain areas, where there are large height variations between adjacent pixels, an incorrect site location becomes particularly evident on the field strength calculation. This is best shown by an example:
A coverage map must be created for an existing transmitter using ERP 40 dBW and antenna height 15 meter. The provided site coordinates is unfortunately not that very accurate, see Figure 1 below. The figure presents a screenshot from PROGIRA® plan where the terrain elevation grid is indicated with squares that have a black coloured outline. Each square represents a pixel of size 100 meter x 100 meter. In the centre of each square the terrain elevation is presented in pink colour. A terrain height contour, where the distance between contour lines is 25 meter, has been generated from the terrain elevation grid and is presented in the map with the pink dash-dot-dot lines.
The given site location is indicated with a red cross and the interpolated terrain elevation height at this location is 1 629.9 meter. By visually examining the background map (Bing Maps) it is obvious that the correct site location instead must be at the location which is indicated with a green cross. At this location the interpolated terrain elevation height is 1 783.5 meter. Between these two sites, it is thus a height difference of more than 150 meter, and according to the Meaure tool the distance location error is almost 290 meters.

Figure 1: PROGIRA® plan screenshot. Terrain elevation grid is indicated with squares that have a black coloured outline. In the centre of each square the terrain elevation is presented in pink colour. The pink dash-dot-dot line represents a generated terrain height contour where the distance between contour lines is 25 meter. The given site location is indicated with a red cross and the adjusted site location is indicated with a green cross.
Figure 2 below presents a screenshot from Google Earth, where this site location error also can be studied. The red pin is the given site location and the green pin is the adjusted site location.
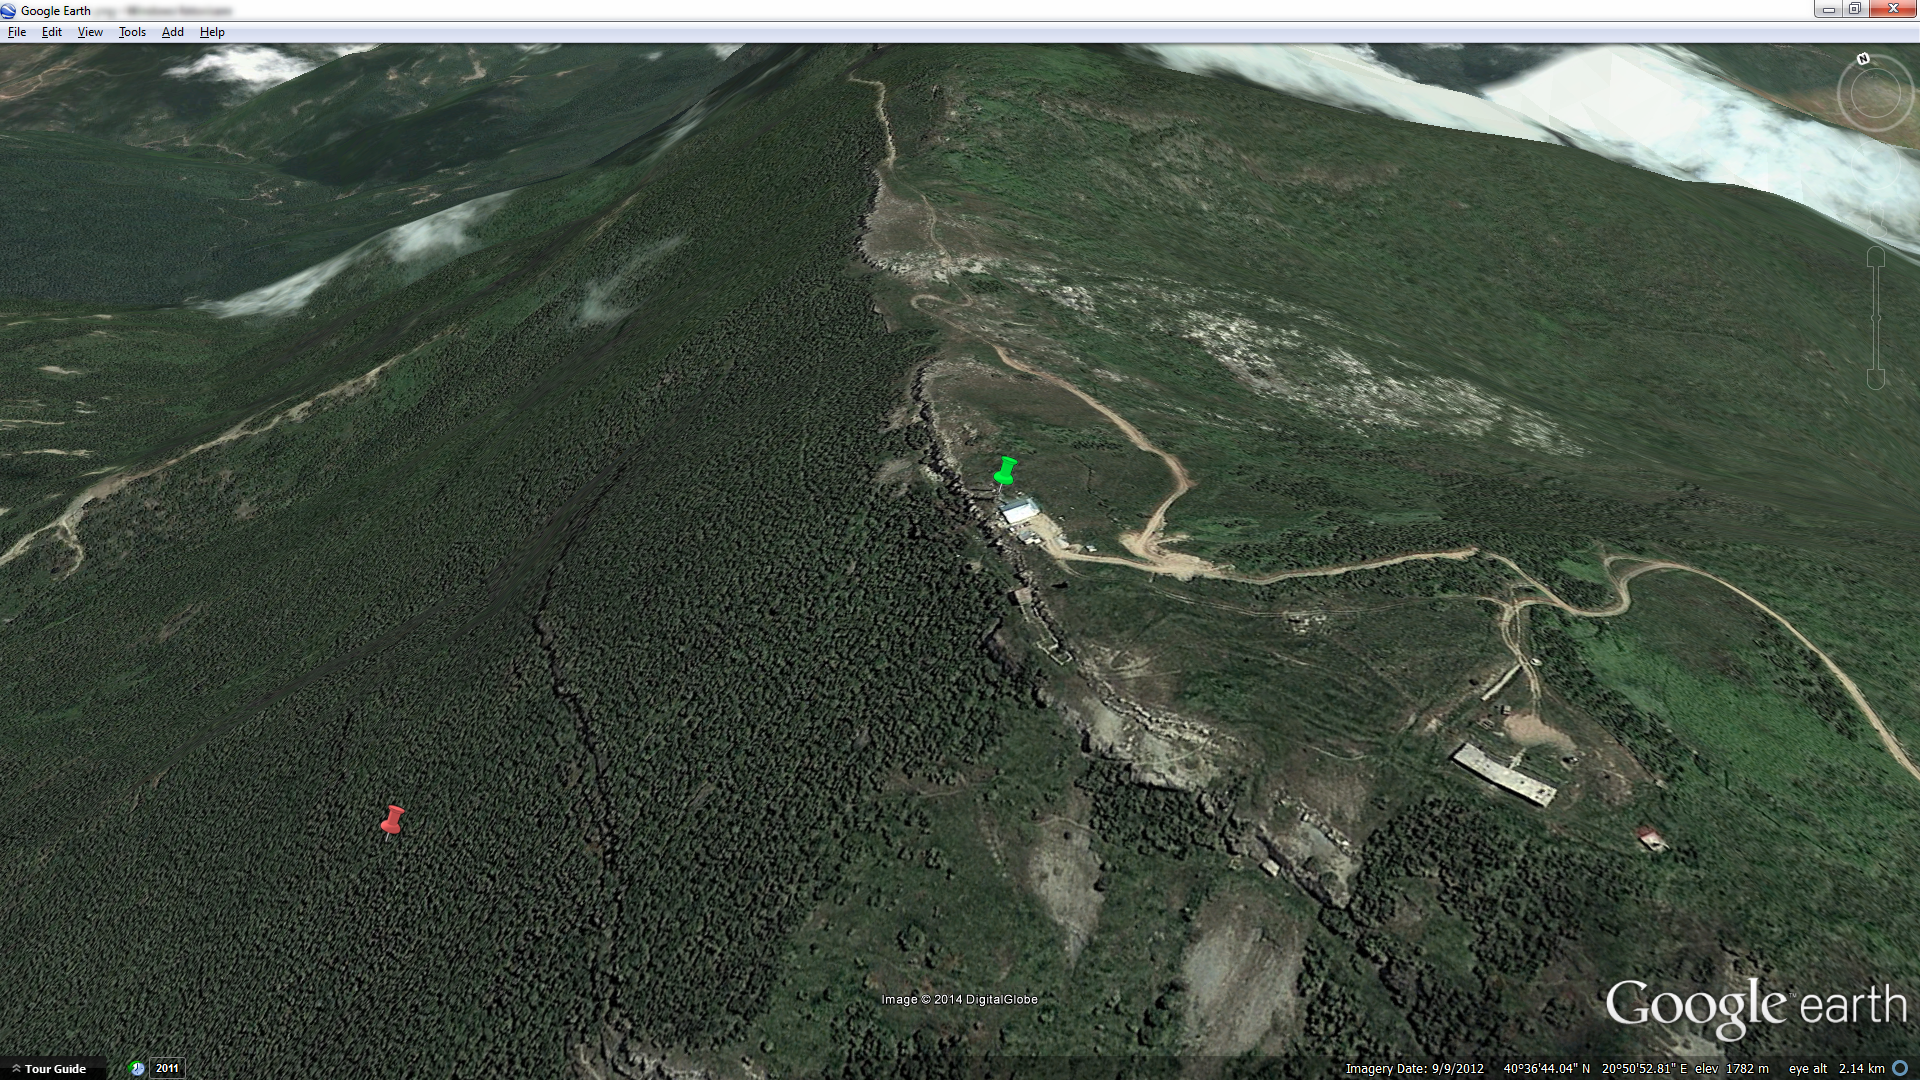
Figure 2: Google Earth screenshot. The red pin is the given site location and the green pin is the adjusted site location.
The incorrect given site location will of course have a great negative impact on the calculated field strength contribution. Because the given antenna height is only 15 meter it will be far below the top of the mountain and it is obvious that the field strength contribution to the eastern side of the mountain will be strongly damped.
In Figure 3 and 4 the field strength contribution for the two site locations are presented. The pink-purple colour represents areas where the field strength levels are above 87 dBµV/m, the dark blue colour represents areas where the field strength levels are above 77 dBµV/m, and the light blue areas represents areas where the field strength levels are above 53 dBµV/m.
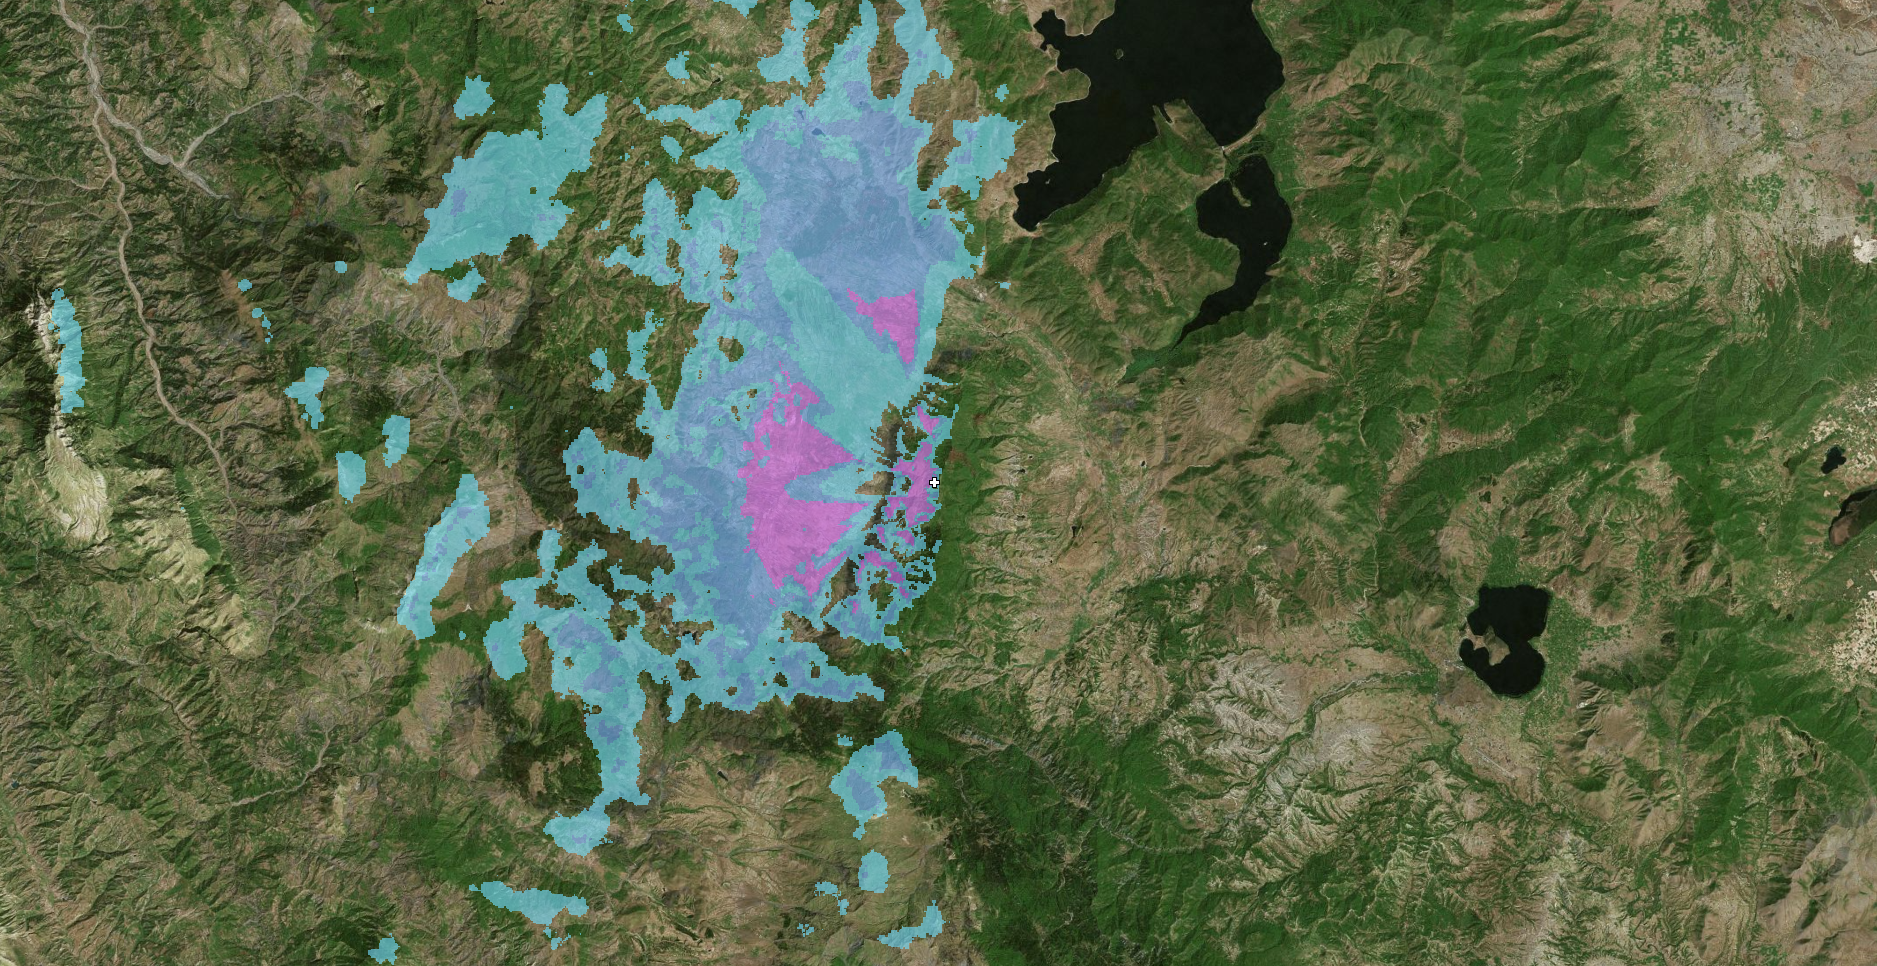
Figure 3: Field strength contribution for the given site coordinates.
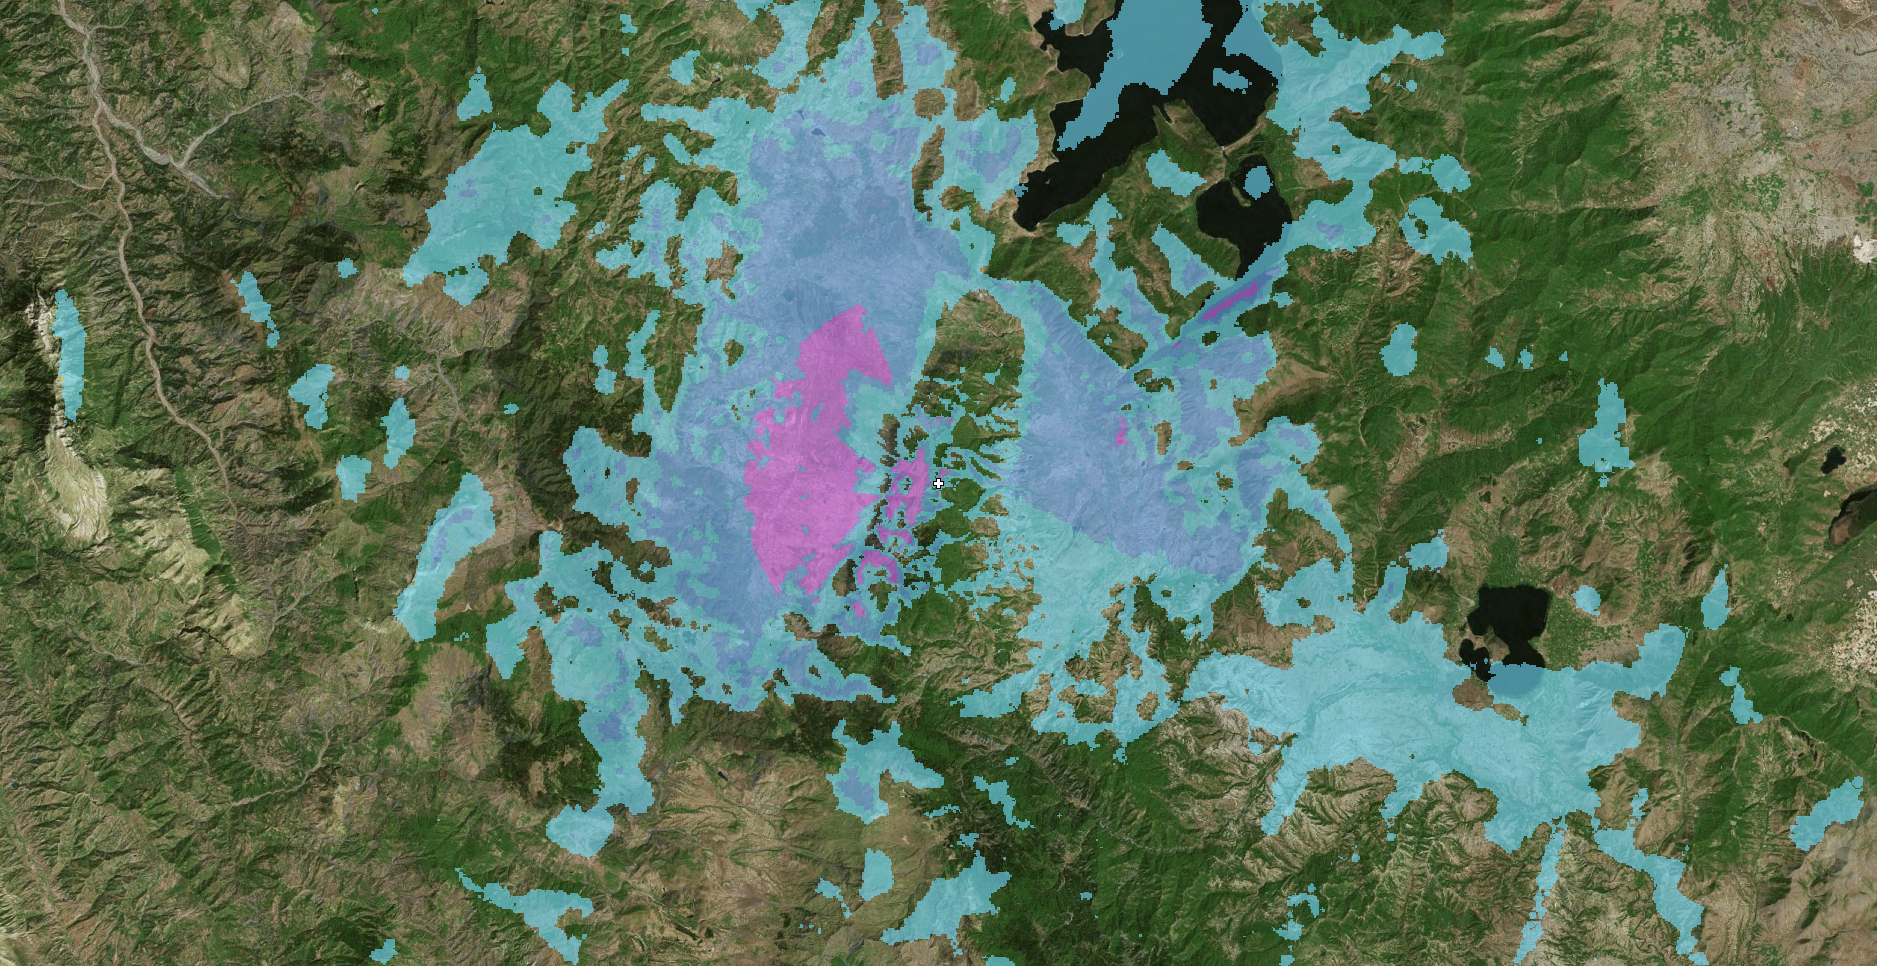
Figure 4: Field strength contribution for the adjusted site coordinates.
–
Thank you for reading this blog post about the importance of conducting a site survey before starting the field strength calculations. If you have any questions about this post don’t hesitate to contact me. All feedback is welcomed!
